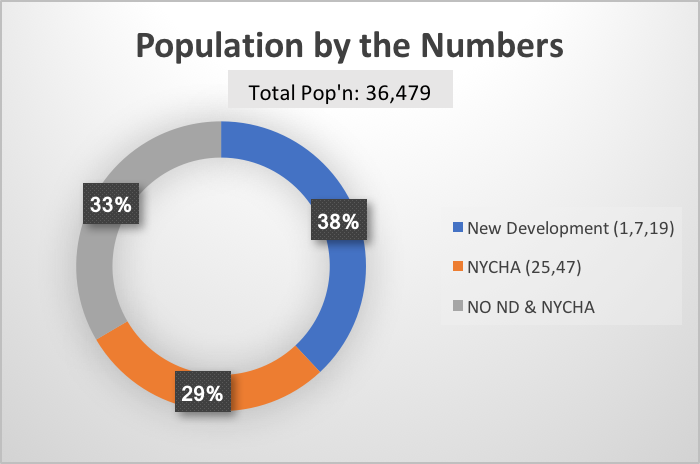
Today, the three geographies of ‘New Development’, ‘NYCHA’, and ‘Other Residents’ each comprise about 1/3 of the population in Long Island City (as designated here).

However, and significantly, ‘New Development’ is the largest and has been the fastest growing, and differs in significant ways from longer-term residents in the neighborhood (See Box 1.1).
Age
Though the median age is similar across geographies, the distribution of ages varies considerably. Whereas residents living in New Development are concentrated in the 25-44 years old bracket, the composition of Long Island City more generally is more evenly distributed across the lifespan. Specifically, NYCHA houses and the larger neighborhood have more youth between the ages of 5 and 17, and more older persons, including twice the number of elderly residents (75 years or older).
[Table forthcoming].
Employment
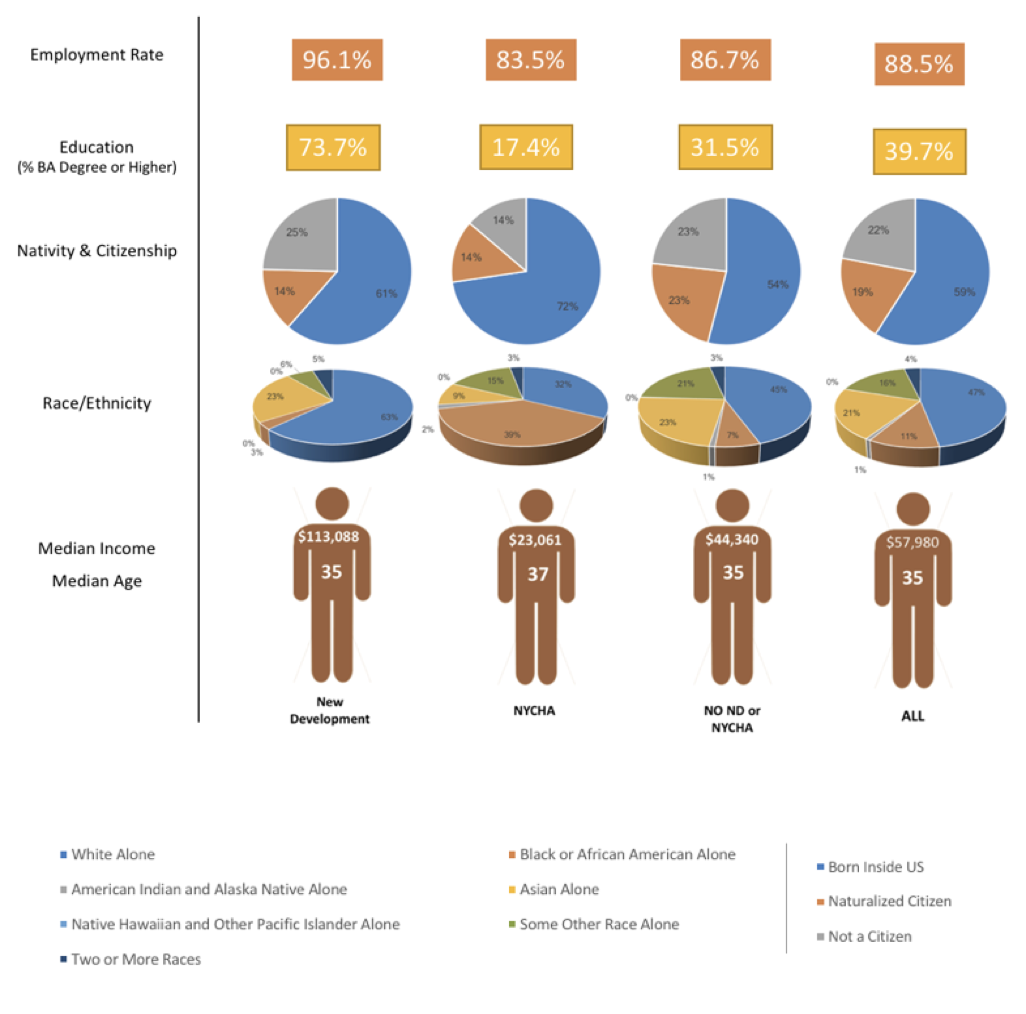
The employment rate in New Development is above average for Long Island City, while below average for NYCHA residents.
| New Development | NYCHA | NO ND & NYCHA | All | |
| Employed | 96.07% | 83.45% | 86.70% | 88.50% |
| Unemployed | 3.93% | 16.55% | 13.31% | 11.51% |
Income
As the differences in median income suggest, the incomes of the residents not only vary widely, but residents are situated at different ends of the economic spectrum: a nearly equal percentage (~20%) of NYCHA residents earn less than $10,000 annually as New development residents earn over $200,000 – meaning LIC is home to some of the most economically vulnerable and most affluent households in the country. This difference doesn’t just exist at the poles. While nearly 90% of NYC residents earn less than $75,000 per year, more than 65% of New Development residents earn more than $75,000 per year, with over half of those residents earning more than $100,000. Residents who are not a part of NYCHA or New Development fall somewhere in the middle, though residents are closer to NYCHA residents than New Development residents on the economic spectrum.
| New Development | NYCHA | NO ND & NYCHA | All | |
| Less than $10,000 | 5.93% | 24.40% | 10.27% | 11.54% |
| $10,000 to $24,999 | 6.90% | 30.80% | 19.20% | 18.06% |
| $25,000 to $49,999 | 8.63% | 23.45% | 25.47% | 20.93% |
| $50,000 to $74,999 | 13.33% | 10.60% | 15.66% | 14.23% |
| $75,000 to $99,999 | 9.17% | 4.90% | 9.96% | 8.92% |
| $100,000 or more | 56.17% | 5.85% | 19.51% | 26.40% |
Race/Ethnicity
As a whole, with over 50% of residents identifying with a race/ethnicity other than white, Long Island City is a diverse neighborhood. However, certain racial/ethnic groups are geographically concentrated in some areas more than others. For example, a greater proportion of New Development residents are white (63%) in comparison Long Island City in general (47%) and NYCHA houses (32%). In contrast, NYCHA houses are home to the largest portion of Black or African American residents. There are also high proportions of the populations of NYCHA and other non-New Development areas that identify as ‘Some other Race’ than New Development (15%, 21% and 6% respectively).
| New Development |
NYCHA |
NO ND & NYCHA |
All |
|
| White Alone | 62.70% | 32.45% | 44.44% | 47.01% |
| Black or African American Alone | 3.17% | 38.95% | 7.10% | 11.43% |
| American Indian and Alaska Native Alone | 0.00% | 1.70% | 0.94% | 0.83% |
| Asian Alone | 22.97% | 9.20% | 23.37% | 20.91% |
| Native Hawaiian and Other Pacific Islander Alone | 0.00% | 0.10% | 0.19% | 0.13% |
| Some Other Race Alone | 6.33% | 14.75% | 20.67% | 16.10% |
| Two or More Races | 4.77% | 2.95% | 3.33% | 3.63% |
Long Island City is also home to a sizeable Asian (21%) and Hispanic or Latino (35%) population. Below are tables specifying which Asian and Hispanic or Latino groups call Long Island City ‘home’. See Attachment A for maps showing geographic distribution.
| New Development | NYCHA | NO ND & NYCHA | All | |
| Hispanic or Latino: | 14.13% | 41.40% | 42.64% | 35.31% |
| Mexican | 2.97% | 7.95% | 11.50% | 8.78% |
| Puerto Rican | 3.07% | 14.90% | 9.76% | 8.94% |
| South American: | 4.37% | 7.70% | 10.73% | 8.63% |
| Colombian | 1.90% | 2.35% | 2.80% | 2.50% |
| Ecuadorian | 2.27% | 2.60% | 4.86% | 3.83% |
| Peruvian | 0.07% | 1.80% | 1.50% | 1.19% |
|
|
New Development | NYCHA | NO ND & NYCHA | All |
| Asian Indian | 9.97% | 14.45% | 12.89% | 12.42% |
| Bangladeshi | 0.70% | 10.45% | 33.19% | 21.28% |
| Chinese, Except Taiwanese | 33.00% | 45.35% | 24.21% | 29.93% |
| Filipino | 13.07% | 1.05% | 11.51% | 10.16% |
| Japanese | 9.00% | 0.80% | 2.47% | 3.83% |
| Korean | 21.73% | 20.80% | 6.37% | 12.62% |
| Taiwanese | 3.23% | 0.00% | 1.67% | 1.78% |
| Thai | 2.30% | 0.00% | 1.14% | 1.24% |
| Other Asian, Not Specified | 0.77% | 7.15% | 2.24% | 2.69% |